For subscription businesses

Add subscribers in the neighbourhoods where they stay

Scaling a subscription is a bet on geography: acquisition earns back only where likely subscribers are dense enough, and margin holds only where they stay. Spread spend across areas that were never dense enough, or win members in neighbourhoods that churn, and the model quietly leaks. IRIS reads where your likely subscribers cluster and where retention is easiest to defend, so you grow on evidence instead of instinct.

Aerial of a residential neighbourhood where subscribers live

Where to grow next

See where subscriber density pays for the route

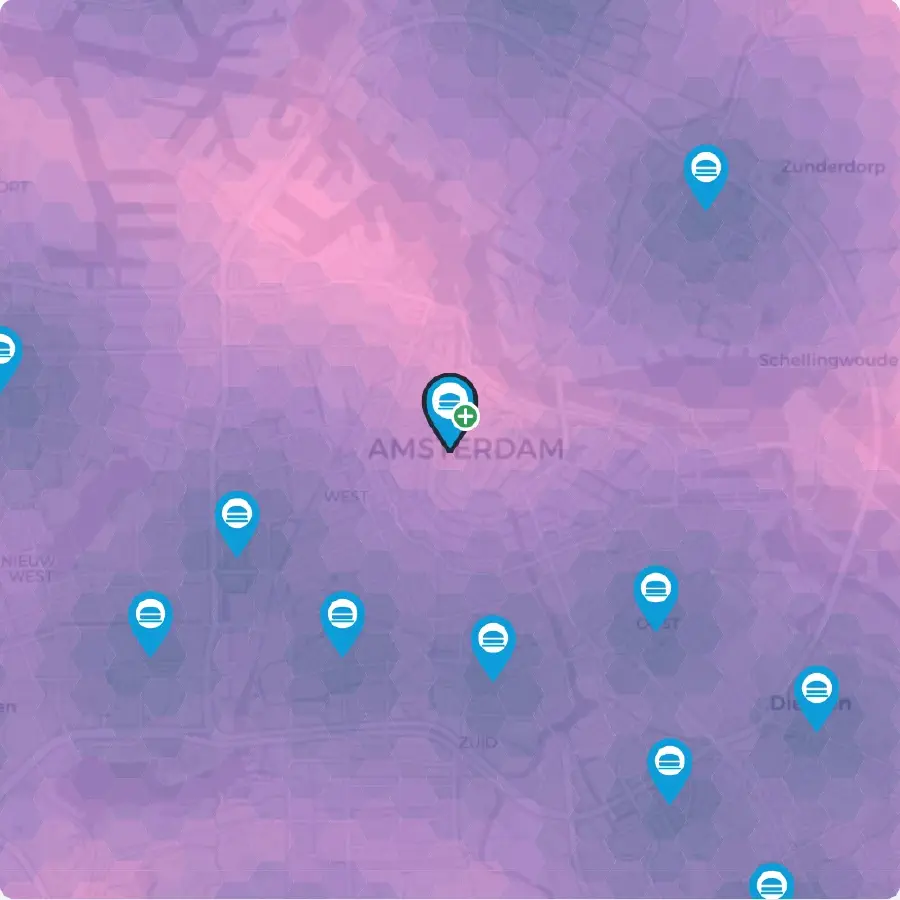
Channel dashboards tell you where a click was cheap, not where a subscriber earns back. IRIS maps likely-subscriber density against the members you already hold and lights up the gaps: the neighbourhoods dense enough to earn back acquisition cost that you have not won yet, and the ones you already serve to saturation.

Each area is read on more than 100 local signals, from household composition and purchasing power to daily footfall, so acquisition goes where the demand actually is rather than where a channel just happened to look cheap.

  • Likely-subscriber density mapped against the members you already hold
  • The neighbourhoods dense enough to earn back acquisition cost
  • The areas already served to saturation, so spend skips them
IRIS coverage-gap (white-space) map of Amsterdam: bright areas are dense with likely subscribers you have not won yet, darker areas are already served to saturation. Illustrative sample. Illustrative sample

Who is in the catchment

Know who your next subscribers are, not just how many

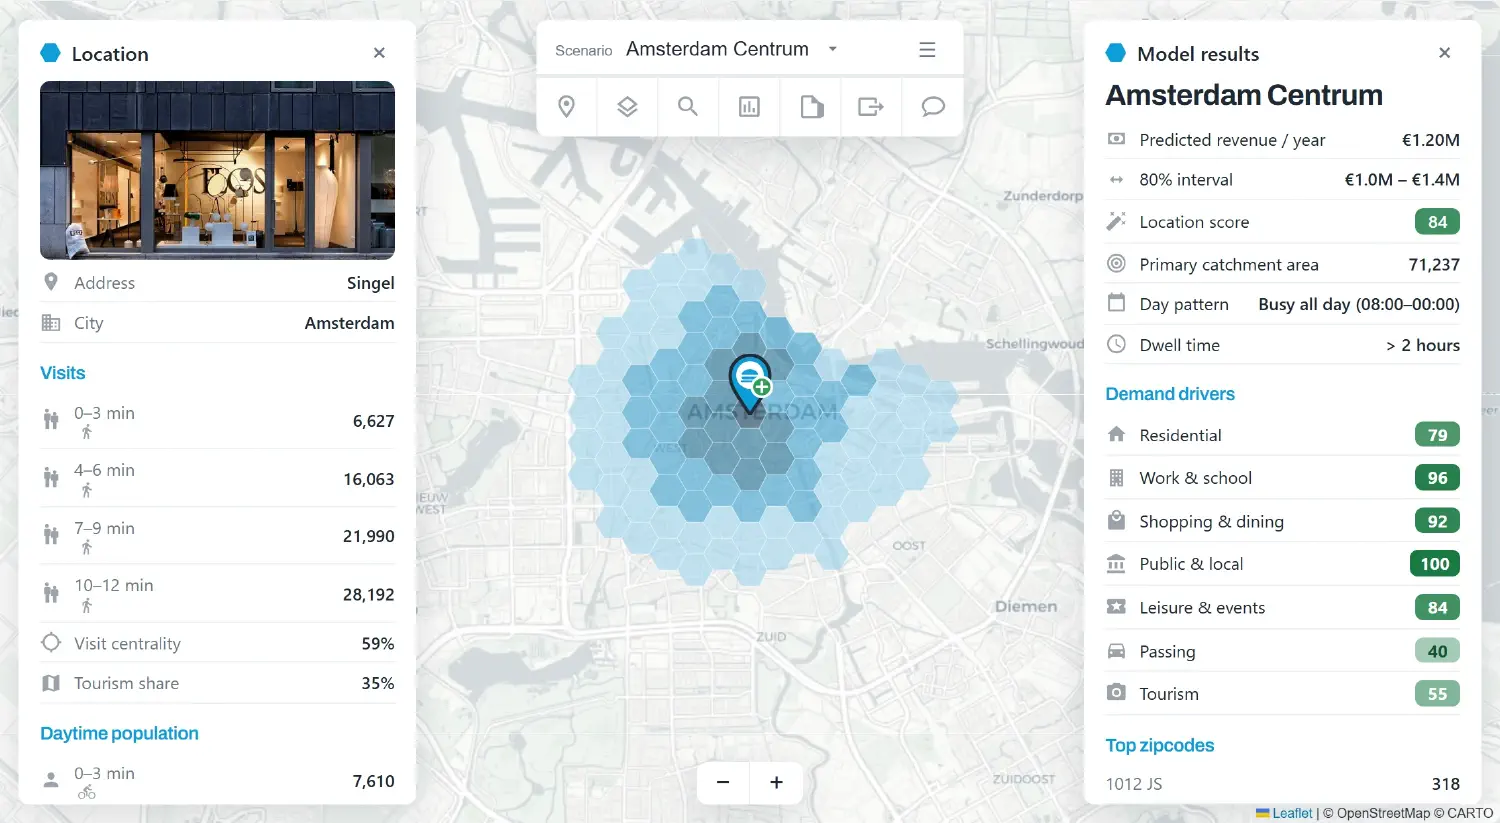
A headcount tells you a market is big, not that it will subscribe or stay. IRIS breaks each neighbourhood down by what actually drives demand, and by who those people are: income, education, age and household mix, the traits that separate a market that converts and renews from one that looks large and churns.

That is what lets you target acquisition at the households your best subscribers already resemble, instead of buying reach across a postcode and hoping the retention curve holds.

IRIS location view for a neighbourhood: what drives demand by category, alongside who lives there, income, education, age and household mix, on the map and catchment. Illustrative sample.Illustrative sample

Sequence the rollout

Rank neighbourhoods before you spend to win them

IRIS ranks candidate neighbourhoods by modelled subscriber density and places each against the areas you already win. Most of the time the useful output is not an absolute figure, it is the rank: knowing this area sits second in your own footprint is a far easier call to defend than a number nobody can sanity-check.

That rank is also a sequence. Expand into the densest areas first, then work outward as the model calibrates to your own subscribers and the thinner areas either earn their place or drop off the list.

Subscriber-density indexSample
1 Dense urban core 94
2 Inner suburbs 76
3 Commuter belt 58
4 Outer ring 37
5 Rural fringe 18

Illustrative sample. Neighbourhood types ranked 0 to 100 by modelled likely-subscriber density for a fictional service area.

Reduce churn by area

Defend retention where it is easiest to hold

The same read that finds density also tells you where members stay. Retention is not spread evenly across a map: dense, stable, well-matched neighbourhoods hold onto subscribers, while thin or poorly-matched ones leak members that no win-back campaign fully recovers.

IRIS flags where retention is structurally easiest to defend, so you weight acquisition toward areas that hold and stop pouring win-back budget into areas that were always going to churn.

12-month retention by area typeSample
Dense urban core 91%
Inner suburbs 84%
Commuter belt 72%
Outer ring 61%
Rural fringe 48%

Illustrative sample. Modelled 12-month retention by neighbourhood type for a fictional subscriber base, not a measurement of any client.

Ready when you are

Grow where subscribers are dense, and where they stay

See IRIS run on your own footprint. We will map where your likely subscribers are densest, show which areas hold retention and which leak, and walk you through the reasoning behind every read, before you commit a euro of acquisition spend. When you want that proven rather than shown, a Validation Sprint puts our error on areas you already serve, from €4,000 for the Kick Start.