For quick-service restaurants

Put your next restaurant where the demand really is.

The wrong site slows growth, stretches delivery times and eats into the stores you already run. IRIS scores high-traffic zones for new openings and weighs the eat-in, takeaway and delivery trade-offs, so you can defend the call before you sign.

  • Score high-demand zones before you shortlist a site
  • Model eat-in, takeaway and delivery demand separately
  • Catch cannibalisation before you sign the lease

Four freshly made cheeseburgers in kraft-paper trays, held out on a tray by a member of quick-service restaurant staff.
Quick-service, ready to serve

The method

Start with the stores you already run

A new site's revenue is not guessed from a template. IRIS forecasts it by comparing the candidate to the restaurants you already run, matched on what actually drives trade, and shows each comparable's predicted base beside its real takings. You see which of your own stores the number leans on, and how well the same method held up on them, before you trust it for the next one.

Revenues of similar stores

Amsterdam Centrum · Singel Sample

Amsterdam Centrum
€1,200,000
Current location
Utrecht Centraal (181)91.7% match
€1,142,000
€1,205,000
Rotterdam Lijnbaan (82)91.3% match
€947,000
€902,000
Den Haag Spui (33)91.1% match
€1,111,000
€1,061,000
Eindhoven Demer (140)90.3% match
€1,036,000
€1,180,000
Groningen Herestraat (57)89.8% match
€1,010,000
€1,050,000
Predicted base Actual takings

Find the top sites

Find the sites with demand you can reach

A drive-thru and a counter-service unit are not the same bet, and they do not read the same signals. IRIS scores each candidate on what actually drives it and shows where your network is still thin, so you shortlist the sites with demand you can genuinely reach.

  • Drive-time and passing traffic for drive-thru; footfall for counter-service
  • Eat-in, takeaway and delivery demand scored separately, each with its own range
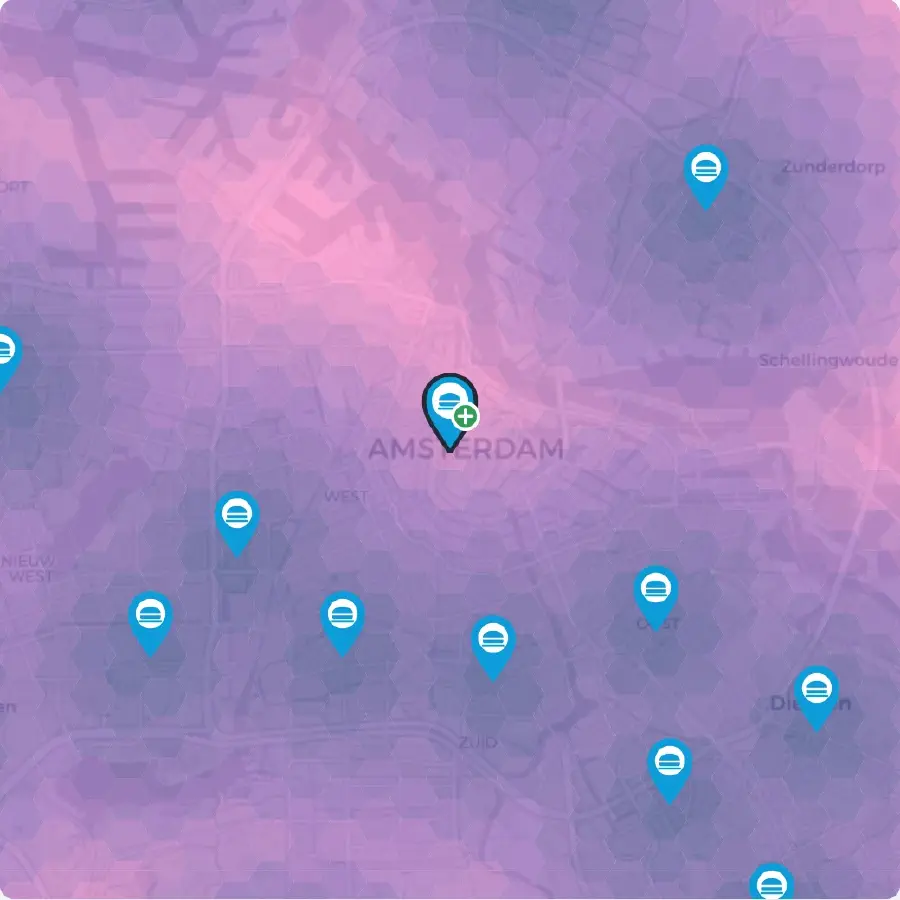
  • A coverage-gap map of the white space your network has not filled
IRIS coverage-gap (white-space) map of Amsterdam: bright areas are under-served white space, darker areas are already well covered by your existing sites. Illustrative sample. Illustrative sample

Read the demand

Know who is in the catchment, and who only looks close

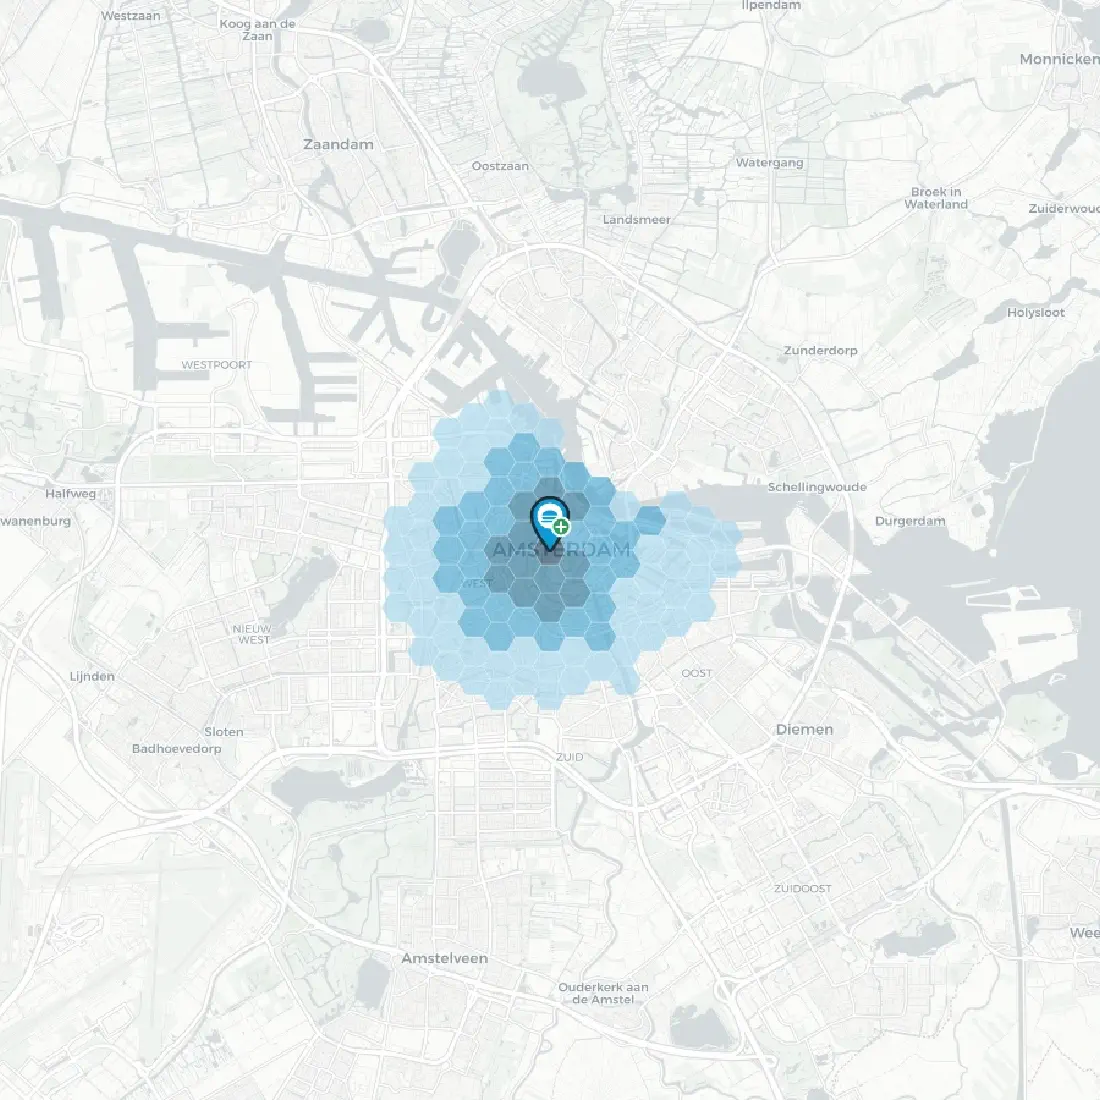
Two sites can hold the same headcount and sell nothing alike. IRIS reads who the catchment is and when they are there, so you can tell a workday-lunch pitch from an evening-delivery one before you sign. Read more on the demand drivers, and what feeds each.

  • Who the catchment is: workers, students, residents and visitors
  • A day pattern that tells a lunch-led site from an evening one
  • The same read on every candidate, so you compare like for like
IRIS catchment map around a candidate site in Amsterdam Centrum, the site marker at the centre with its travel-time catchment drawn as hexes. Illustrative sample. Illustrative sample

Delivery reach

See how far your delivery reaches inside the promise

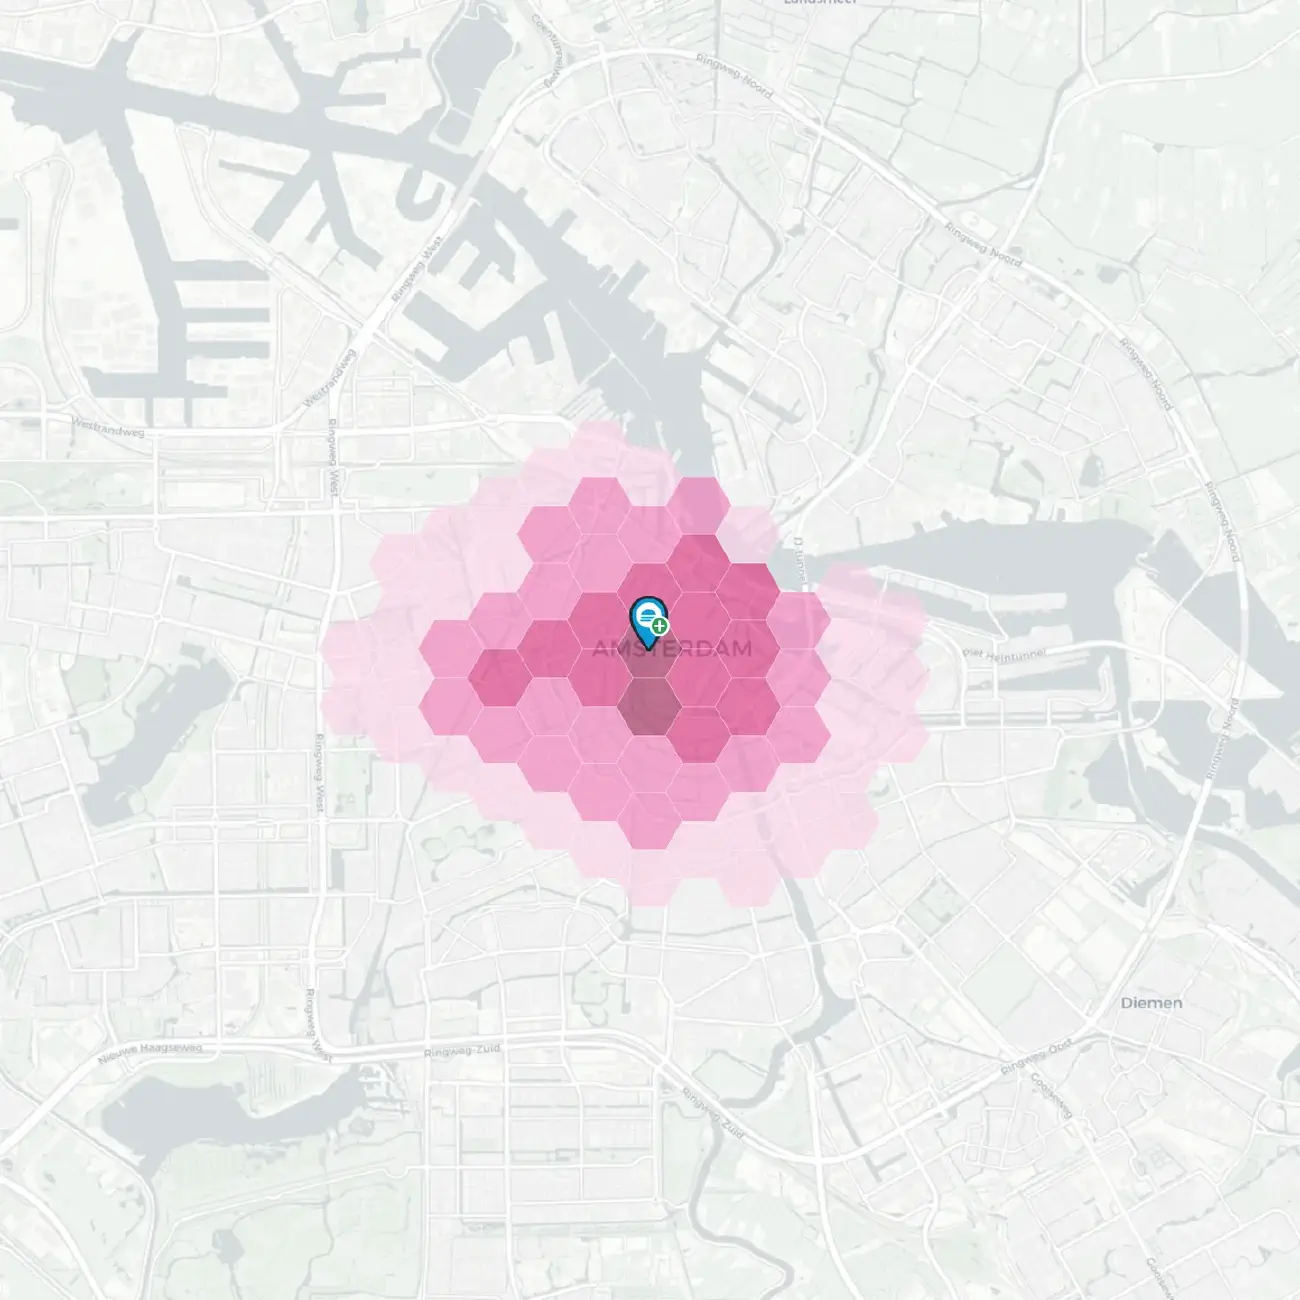
Delivery does not travel as the crow flies. IRIS maps the bike and scooter catchment a site can serve inside your delivery-time promise, so you know the reach before you sign, not after the first slow Friday night.

  • A delivery catchment measured on real bike and scooter travel time
  • See where delivery zones overlap, and where demand is left unserved
  • Weigh a site's delivery reach against stores already meeting the promise
IRIS bike-and-scooter delivery catchment around a candidate Amsterdam site, drawn as travel-time hexes densest at the site and fading outward. Illustrative sample.
Illustrative sample

Move the whole network

Expand, relocate, consolidate without eating your own stores

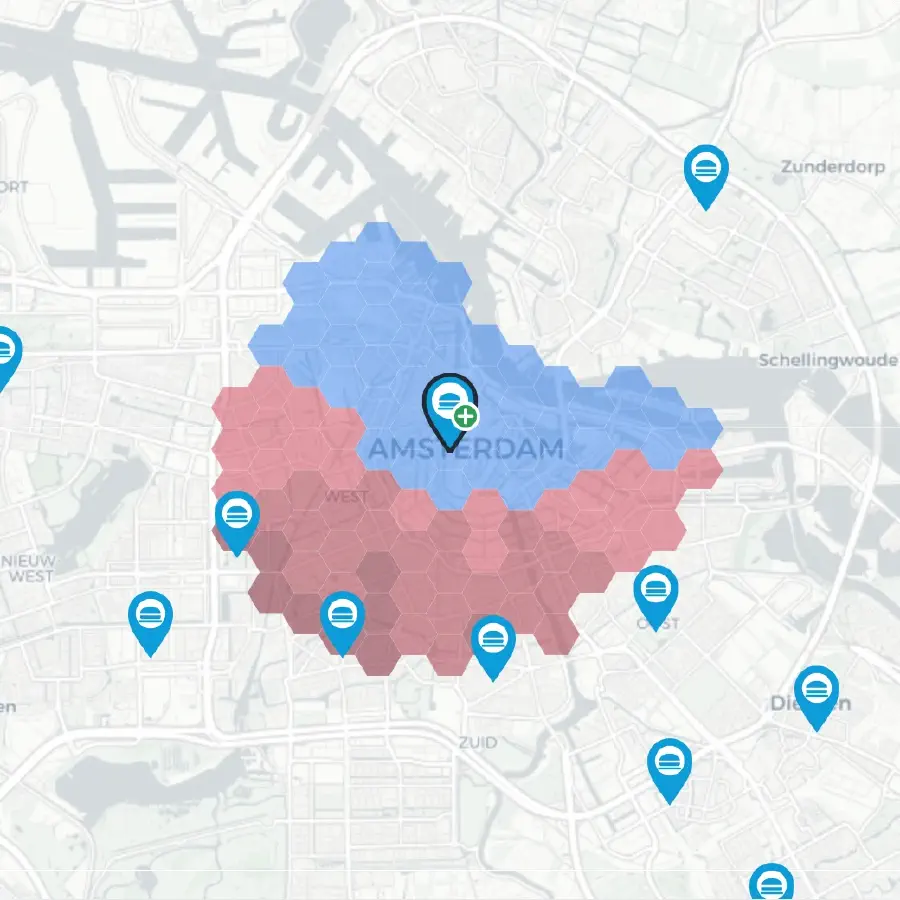
Open two sites too close together and the second just eats into the first. IRIS simulates the sales transfer between overlapping trade areas, so you see exactly how much a new opening, a relocation or a closure pulls from the stores you already run.

  • See what share of a new site's catchment is genuinely new
  • Weigh the net gain to the whole network before you commit
  • Model the moves together, and watch the catchment redraw
IRIS impact map for a candidate Amsterdam site: blue hexes mark newly captured catchment, red hexes mark demand cannibalised from nearby own stores. Illustrative sample. Illustrative sample

Proof

Delivery fit, modelled across a 130+ location chain

Delivery fit is a specific combination of signals, not headcount alone. IRIS scored 130+ Kwalitaria locations on that combination as delivery grew from 20% to nearly half of revenue in two years. In the underlying analysis, locations doing delivery as well as takeaway ran ahead of takeaway-only ones. Every forecast is first held against openings you already know, so you can judge the fit before you commit. Published analysis: Locatus.

Kwalitaria · Food Franchise Company

Delivery sites beat takeaway-only locations

IRIS scored each site on the specific mix that drives delivery, not headcount alone. In the published analysis, locations doing delivery as well as takeaway ran about 30% ahead of takeaway-only ones over two years.

+30%
over two years vs takeaway-only sites, in the analysis

How you check it

Scored against your real past openings, not a pitch deck

Every site forecast is checked against comparable openings the model was never shown before it reaches the board, and we check the range is honest, not just whether the point lands close.

4 in 5
is what an honest 80% range should contain

See it on your own restaurants

Find your next site, and protect the ones you already run

Book a demo and we will run IRIS on your own restaurants. Or start with a Validation Sprint: we forecast sites you already trade in, kept back from the model, so you can see how close we get before you sign the next lease.