How it works · What it will make

IRIS forecasts a site's revenue, then checks itself against your stores

A vacant unit in Amsterdam is on your shortlist. What will it make in its first year? IRIS forecasts that number from the stores you already run, with its 80% interval and the demand drivers attached, then checks itself on stores the model never saw.

  • Draws on open and proprietary data sources
  • Weighs what is within reach of the site
  • Forecasts revenue with a model tailored to your brand
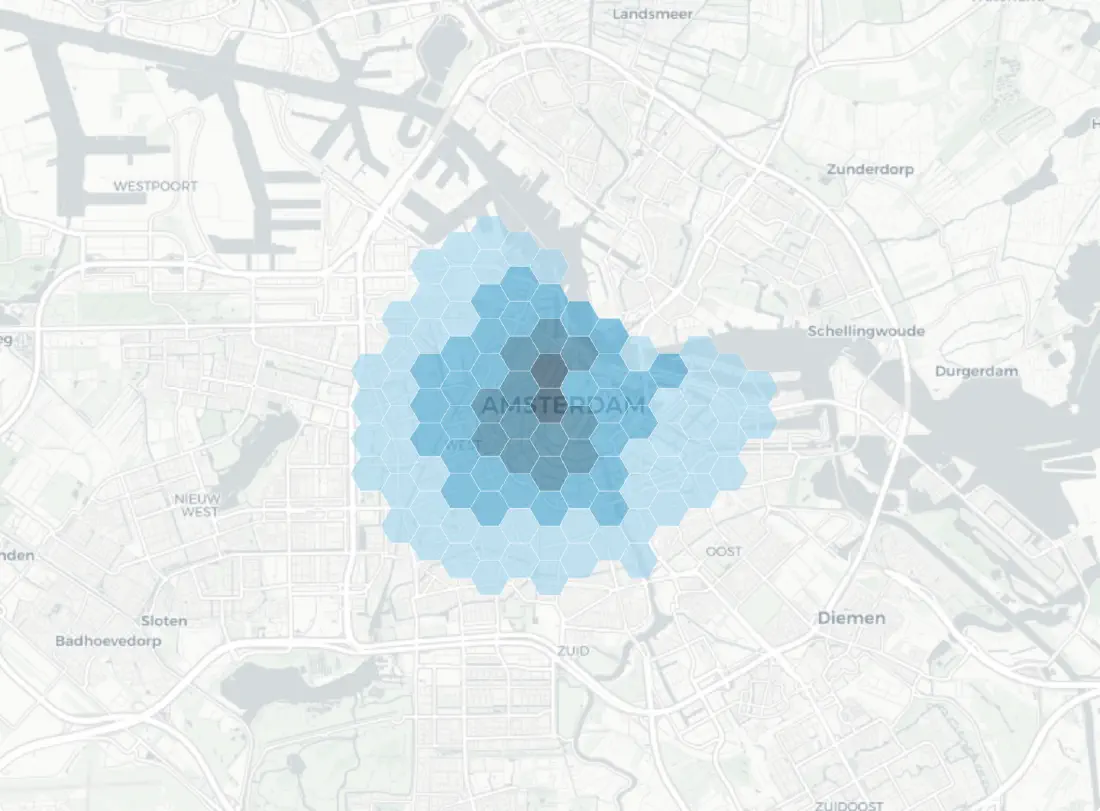
Illustrative sample: map of the Singel catchment in Amsterdam
Illustrative sample: street-level view of the candidate storefront on the Singel
Amsterdam CentrumSingel

Why nearness matters

Closer people come, and come more often

Two people the same distance from a site are not worth the same to it. The nearer someone is, the more likely they are to visit, and the more often. So IRIS does not count heads inside a ring; it weighs every part of the catchment by how reachable the site really is.

Drive timeResidentsReachabilityWeighted
0–3 min2,59745%1,169
4–6 min9,82926%2,556
7–9 min25,60213%3,328
10–12 min33,2096%1,993
Primary catchment71,2379,046

Illustrative example, the same Singel catchment used across the site.

Car catchment · nighttime population

45%26%13%6%50%25%0%Likelihood to visit0–34–67–910–12Drive time to the site (minutes)

The comparative study

The comparison a good analyst makes by hand, run at scale

Sizing a new site has always meant comparing it to stores you already run: pick a few that feel alike, judge how close each one really is, and weigh them up. It is sound reasoning, the kind a good analyst or an outside consultancy does by hand, and it usually arrives as a stack of location studies weeks later. It is also slow, and only as good as the handful someone thinks to choose. IRIS runs the same logic automatically, scoring every store you run for similarity rather than guessing which few are comparable. Below is that working, laid out for a vacant unit on the Singel.

The slow way: a handful of hand-picked comparables, written up as a report.

Example comparative analysis

Amsterdam Centrum · Singel Sample

By-hand read A vacant unit on the Singel
≈ €1.2M rough read · wide range

By hand, this means picking a few stores that feel comparable, judging how close each one really is, and reasoning a rough figure above or below their real takings:

  • Utrecht Centraal €1.21M actual · 91.7% match
    a touch below

    Matches on catchment size and station footfall, but a few thousand fewer residents sit within a short drive, so the estimate lands a touch below it.

  • Rotterdam Lijnbaan €0.90M actual · 91.3% match
    well above

    A similar high-street format, but the Singel catchment is denser and less divided by competing units nearby, so the estimate lands well above it.

  • Den Haag Spui €1.06M actual · 91.1% match
    a little above

    Close on resident numbers, but stronger nearby magnets and easier arrival on foot, so the estimate lands a little above it.

  • Eindhoven Demer €1.18M actual · 90.3% match
    just above

    Matches on format and spend per visit, but a larger reachable population, tempered by more direct competitors, so the estimate lands just above it.

  • Groningen Herestraat €1.05M actual · 89.8% match
    above

    A comparable draw, but a bigger and younger resident base within reach, so the estimate lands above it.

  • Haarlem Grote Houtstraat €0.98M actual · 81.2% match
    well above

    A comparable retail street, but a smaller reachable population and a stronger competing centre nearby, so the estimate lands well above it.

  • Leiden Haarlemmerstraat €1.12M actual · 79.0% match
    a touch above

    Close on catchment and student footfall, with slightly easier arrival on foot, so the estimate lands a touch above it.

Weighed together, a handful of comparable stores puts the Singel unit somewhere around €1.2M, give or take a few hundred thousand. That is what the by-hand method is: a rough figure and a range, a sanity check, not a precise forecast, and only as good as the few stores someone thinks to pick. IRIS runs the same reasoning with statistics, weighing every store you run by how similar it is rather than guessing which handful is comparable. That is how the real forecast gets tighter, and stops depending on a lucky choice. The five closest matches are checked out of sample below.

Why you can trust the number

A model of your business, checkable against your business

The forecast is not a guess and not a lookup. IRIS grounds every number against the real takings of comparable stores you already run, including ones the model was never trained on. The number arrives already tested against the part of your business you know best. None of it is a black box: see how we build and validate the model.

Fittedto your estate, not a generic template.
Weighedby real reachability, not a flat headcount.
Checkedagainst stores you already know, including ones the model was never trained on.

Predicted against actual

The comparable stores, checked out-of-sample Sample

UtrechtPred €1.14M · Act €1.21MRotterdamPred €0.95M · Act €0.90MDen HaagPred €1.11M · Act €1.06MEindhovenPred €1.04M · Act €1.18MGroningenPred €1.01M · Act €1.05M€0€0.5M€1.0M€1.5MPredicted first-year revenue€0€0.5M€1.0M€1.5MActual takingsperfect predictionwithin 10% Each dot is a store the model was checked against, not trained on. The shaded band is a 10% deviation range; four of the five land inside it, and Eindhoven, above it, is the one that does not. Tap or hover a store for its figures.

How sure can you be

Be wary of anyone who makes this look easy

A vendor who hands you a tight, confident band on first-year revenue is hiding the difficulty, not beating it. So we don't. For the Singel unit, what IRIS gives you is an expected figure and the honest range a site like this can land in: its 80% interval.

Even the most sophisticated operators land within 10% of actual first-year takings on only about 60% of their new-store forecasts.

How IRIS compares to the confident number
The box is the nominal 80% interval: we would expect the real number to land inside it about 4 times in 5. The whiskers reach the 99% interval. The dot is the point prediction. Illustrative, and different for every store.€1.20M€1.0M€1.4M€0.80M€1.60M
80% interval99% intervalpoint prediction

Illustrative: one forecast, a value and its nominal 80% interval.

Try it yourself

A sharp model still lands in a range

There is one honest dial that matters: how well the model tracks reality. Open the accuracy lab and drag it up, and the typical error falls. What does not collapse is the width of the nominal 80% range: even for a strong model it stays near plus or minus 20%. That width is the honest part, and no dial removes it.

Try the accuracy lab

See it on your own estate

See the range, proven on your own stores

The honest test is on your estate. A Validation Sprint runs the model on stores you already know, the ones it was never trained on, so you can judge the fit for yourself before you commit. Book a demo and we will walk you through what that would look like on your own numbers.