How IRIS compares

How IRIS compares, including when to buy something else

You are about to sign a lease and commit a fit-out. You deserve a straight comparison, not a rigged one.

  • Named tools, sourced facts, every figure dated
  • Straight about when a rival fits you better
  • Spot an error? Tell us and we fix it
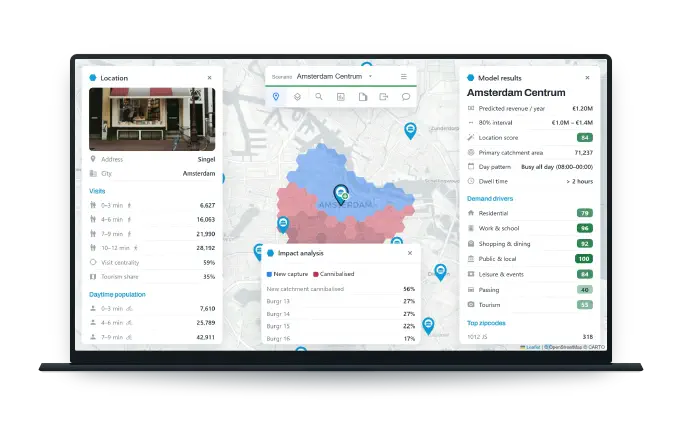
The IRIS demo running on a laptop: the Location panel with visit counts and daytime population for a Singel address in Amsterdam, a map of the city with the candidate site pinned among nearby stores under a hexagon overlay splitting new capture from cannibalised demand, an impact-analysis card, and the Model results panel with predicted revenue, its 80% interval and demand-driver scores. Illustrative sample.

What we will and will not claim

How to read this comparison

Nothing here is a private benchmark or a number we cannot show you. Every claim is drawn from each vendor's own public materials.
Need US foot traffic, a catchment map for one street, or a toolkit for your own data team? "When to buy something else", further down, points you to the right one.
When a vendor leads with a single headline accuracy number, ask on which stores, and whether it was measured on data the model had already seen. IRIS does not quote one, and its 80% range explains why.
The vendor comparison below was read from public sites on 24 July 2026. The cost research is older and says so where it appears: the data-layer figures were reviewed 17 July 2026, the tool and consolidation prices 22 July 2026. Vendors and prices change, so every figure carries the date it was read. Three dates, because there were three reviews. Spot an error? Tell us at info@irisplatform.nl and we will fix it.

The comparison

Six things that decide whether you can defend the number

The tools most often weighed alongside IRIS in Europe for forecasting a new site's revenue are RetailSonar, Targomo, Geoblink (now part of MyTraffic), Geolytix and Kalibrate (Kalibrate is global; the other four are European). They are capable products with real data and real clients. Here is how they line up on the things that decide whether you can defend the number in the room where the capital is committed.

What lets you defend the numberIRISRetailSonar, Targomo, Geoblink, Geolytix, Kalibrate
A forecast shown as a range, not one numberYes. An 80% interval on every forecastNot published by any; none publishes a range
Out-of-sample validation on your own stores, publishedYes. Spatial leave-one-out on stores the model was never shown puts R2 between 0.69 and 0.87 and a typical error between 9% and 21% across the models we have built. A published range, not a single headline figureNot published by any of the five
A method you can open and adjustYes. An auditable, adjustable model: open it, argue with it, change itDescribed publicly as an AI or ML model; some explain the drivers, none we could find publicly exposes an adjustable method
A written accuracy guarantee, money backYes, on the IRIS tier. Miss the R2, MAPE and interval we agree in writing, and your first-year licence for that market is refunded, where that market has 50 or more comparable mature sitesNot published by any of the five
Prices you can see without a sales callYes, both. Licence bands are published (IRIS Market €6,000 a year; the forecasting tiers from €9,000 a year, banded on your whole estate's revenue in that market, so you can find your own band without calling us). The build is a published €12,000 per four-week sprint, and the Validation Sprint is the first of them, credited in full. That sprint runs in two stages, so the way in is a €4,000 Kick Start, and you can stop there. The sprint fixes the remaining count in writing before any build work startsThe forecast price is quote only for all five (Targomo publishes API pricing, but not for its GeoAI forecast)
You talk to the people who build the modelYes. Direct access to the buildersSales-led contact, then a dashboard or a separate data-science or consulting team

"Not published" means we did not find it in the vendor's public materials on 24 July 2026. It is not a claim that a vendor cannot do it, only that they do not show it. Differences between the five are in our research notes.

Among these five forecasters, IRIS is the only one that publishes an honest range, shows its accuracy on your own stores, lets you open the method, stands behind it in writing, and prints its price. That is not a claim to be the most accurate. It is a claim to be the most checkable.

Why trust the method: IRIS is research-led. It is built by a team led by an Assistant Professor at Utrecht University whose field is algorithmic accountability, and is based at UtrechtInc, the Utrecht University startup incubator. That research is the difference behind "auditable".

What IRIS consolidates

One endpoint, instead of a shelf of invoices.

The biggest line item was never a tool. A team assembling GIS licences, geodemographic data, isochrone APIs and a mobility feed spends into six figures a year, and most of it is the analyst who stitches it all together. IRIS replaces that integration and maintenance work, not a wall of logos. Here is what it does and does not replace, in three columns.

€100k to €130k

Loaded cost of one GIS or data-science analyst, per year

NL, base ~€76.5k, loaded for employer cost. Glassdoor, Nov 2025.

IRIS subsumes it

Drop the tool

  • Drive-time and catchment modelling Isochrone / travel-time APIs, ~€700 to €6,000 / yr published list (US/EU)
  • Market-potential and site scoring GIS site-analysis, from $3,995 / yr published (US)
  • Cannibalisation against your own network No self-serve tool we found does this no substitute found
  • The commissioned catchment study €2,500 to €10,000 each, ~€5,000 typical published (BE); you cannot re-run it
Partial overlap

Scope it, keep what is bespoke

  • GIS analytics seats ~$27,274 / yr median actual (list $5,195) published + reported (US)
  • Geodemographic segmentation £15,710 / yr; and £29,950 + £8,500 setup published (UK G-Cloud)
  • Benelux POI and competitor location 3 to 5 year subscription quote-only
You keep it

We do not claim to replace this

  • BI and dashboards €14 to €115 / user / month published; point them at our API
  • Raw mobility used elsewhere Footfall panels for other work quote-only / unpriced
  • Geocoding and embedding APIs Per 1,000 calls published; keep your own

Only published list prices appear as figures, in their published currency and labelled by region. Feeds sold by quote, footfall panels and Benelux POI depth among them, are marked quote-only: no number, because we do not have one. Reviewed 22 July 2026.

Straight talk

When to buy something else

No tool is right for every job. Here is when one of these is the better buy than IRIS.

The forecasters weighed alongside IRIS in Europe

Each of these is a capable product with real data and real clients. What follows is what each is good at, where IRIS is different, and when to buy them instead. Everything said about a vendor was read from their public materials on 24 July 2026, and "not published" means we did not find it, not that they cannot do it.

IRIS vs RetailSonar

RetailSonar positions itself as a Benelux market leader, with a large curated footfall and car-passage data layer and a long retail client list. The difference is what you can check: IRIS publishes its licence bands and its build price, and it measures its error on stores you already run before you commit, where RetailSonar's forecast is a quote-based engagement. Buy RetailSonar if that data depth and enterprise delivery fit you and a quote is fine.

IRIS vs Targomo

Targomo is leading travel-time and isochrone routing, with a published pay-per-use developer API. It is a different layer of the stack: Targomo tells you what is reachable, IRIS tells you what a site will earn and how sure you can be, as a revenue forecast with an 80% interval and the demand drivers behind it. Many teams use reachability data and a forecast for different jobs. Buy Targomo if you need routing and reachability infrastructure to build on.

Geoblink, now part of MyTraffic, is a broad location-intelligence dashboard covering catchment, cannibalisation and territory, with a sales forecast as one feature and MyTraffic footfall data behind it. IRIS is narrower on purpose: it does one job, and it publishes the range around every forecast and its out-of-sample error on your own estate. Buy Geoblink if you want the wider dashboard and forecasting is one need among several.

IRIS vs Geolytix

Geolytix builds consultant-led models with driver explainability, from an established UK data-science team. The difference is ownership and repeatability: IRIS is a platform your own team re-runs the moment the site list moves, with the model and its outputs yours to keep, rather than a study commissioned each time. Buy Geolytix if you want a hands-on consulting build.

IRIS vs Kalibrate

Kalibrate is a long-established global vendor with a full software-plus-services stack, strongest in fuel and convenience networks. IRIS is European by design, hosted and processed in the EU with no US mobile-location panel, and it prints its prices instead of routing you to a sales call. Buy Kalibrate if you run a large multi-site network and want that heritage.

When a narrower tool is enough

  • Footfall data (MyTraffic in Europe, Placer.ai, Unacast and PassBy in the US): buy them if what you actually need is a foot-traffic feed to pour into your own analysis, not a delivered forecast.
  • Catchment mapping (Smappen): buy them if you want an affordable, self-serve drive-time catchment and demographics map and do not need a revenue forecast.
  • Geomarketing data (inAtlas for Spain and Portugal, Plaace for the Nordics): buy them if you want regional lead generation or an area-level fit score.
  • A GIS toolkit to build in yourself (CARTO, Esri ArcGIS): buy them if you have a data-science team and want to build and own the model in your own stack.
  • US site selection (Buxton, SiteZeus): buy them if you are a US brand; both are built for the US market.

The manual location report (a consultancy, not a tool)

Some teams still commission a site-selection consultancy to produce a location report by hand. Buy that if you want a person to walk the street, meet the landlord and read the pitch for one flagship site. For a portfolio, or for a number you will revisit as the site and the market change, a report has limits a model does not:

  • it takes weeks, and a fee per site
  • it arrives as one document you cannot re-run
  • it leans on a few hand-picked comparables, not every store you already run
  • it lands on a single confident number rather than an honest range
The bottom line

A forecast you can open, check, and defend

If you want the widest dashboard, the deepest footfall panel, or a person for one flagship site, this page told you where to go. If you want a site revenue forecast you can open, check on your own stores, and defend in the room, that is the one thing IRIS is built to do. Book a demo and we will show you, or go straight to a Validation Sprint and see our error on your own stores first, from €4,000 for the Kick Start.