Revenue forecasting for site selection
Forecast what your next site will earn, then defend the number to the board.
IRIS forecasts revenue, shows the prediction interval and sales drivers, and validates it on your own stores.
- Refunded first-year licence if we miss the The R2, MAPE and prediction interval set in your order form. IRIS tier only, in markets with 50 or more comparable mature sites. accuracy
- Validated on your own stores before you sign
- Published prices, per market. No "contact us" to see them

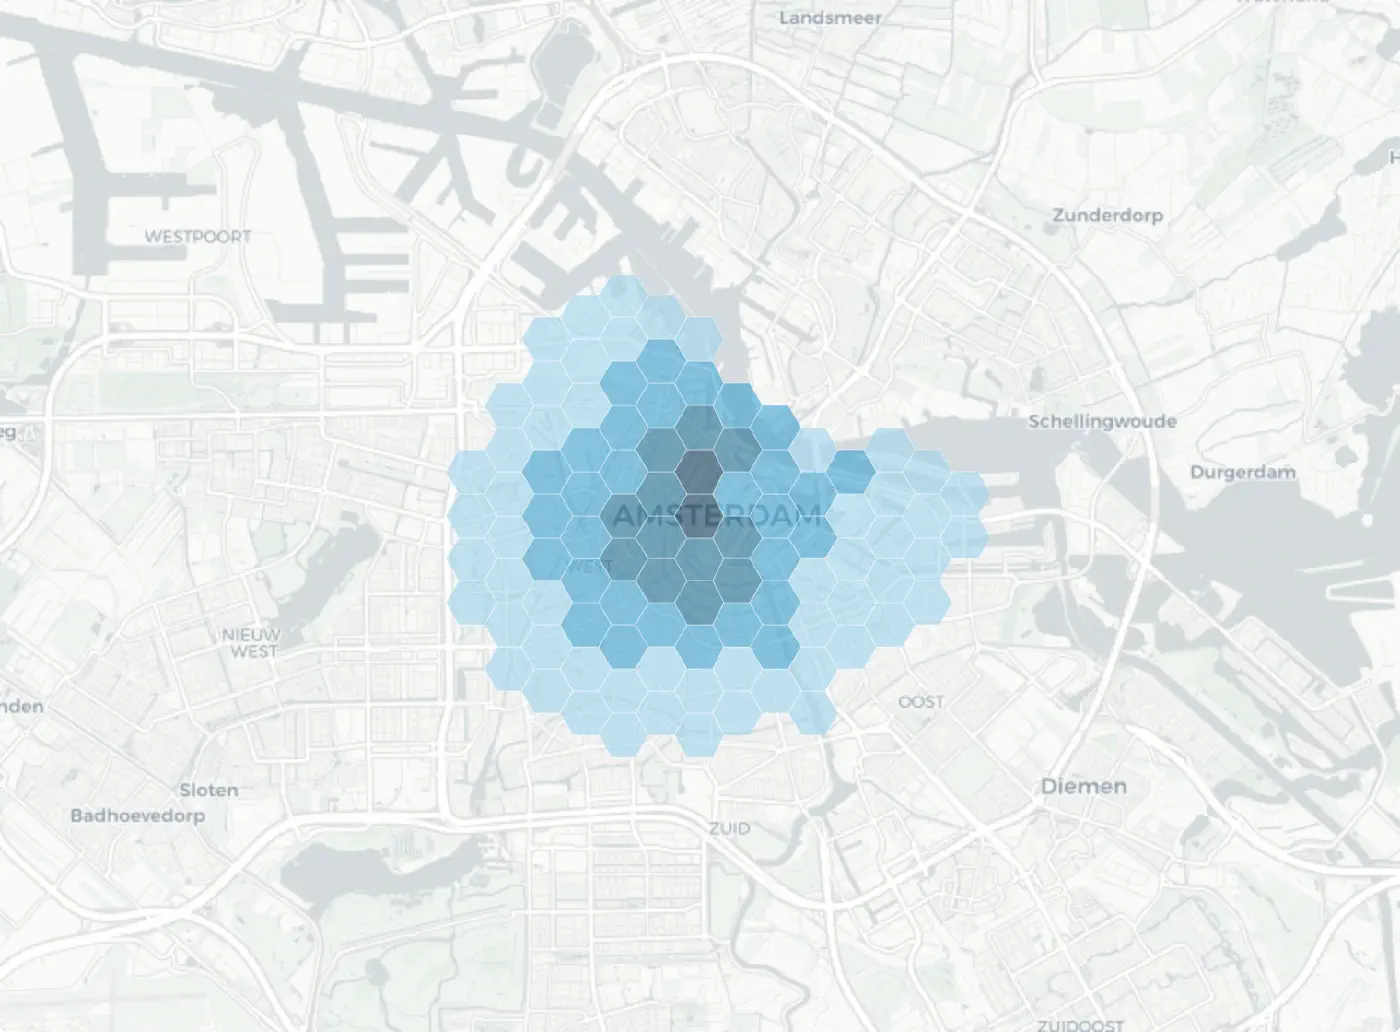
- Singel Amsterdam

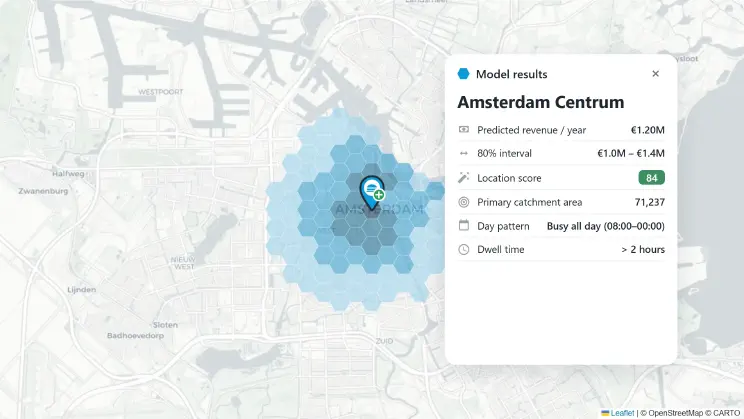
Amsterdam Centrum
In use at expansion teams across Europe






Know what you are being sold
We won't quote a generic accuracy number.
The usual alternative is a gut-feel call, or a report you cannot re-run. Anyone can quote a percentage before seeing your data, and no one can check it. A single confident number hides the one thing that matters: how wrong it could be. So once we have seen your stores, you get two honest things instead: the accuracy we hit on stores of your own the model never saw, and the range around every forecast, with how often reality lands outside it.
The same figure, with its range, checked on stores you already run.
The platform
Try the interface for a sample location.
Catchment analysis
See who a location can reach, by drive time and travel mode.
Revenue models
Forecast turnover for new and existing sites, per revenue stream.
Cannibalisation
See how a new opening affects the network you already run.
Scenario planning
Compare openings, relocations and closures side by side.
Revenues of similar stores
Sample location report
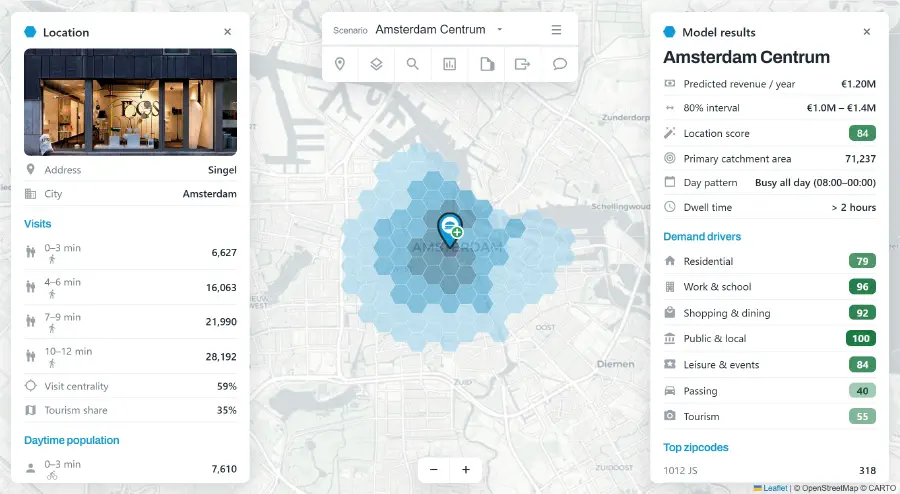
IRIS rates an 84/100 location. It pairs a dense residential and daytime-work catchment with exceptional public-amenity and shopping density, and moderate tourism and passing trade. Predicted revenue is €1.20M per year, 80% likely between €1.0M – €1.4M, with a five-year potential of €1.6M.
Key figures
Demand drivers
Population & visits
Sociodemographics
Catchment by drive time
Most similar stores
| Store | Match | Predicted base | Actual |
|---|
Ready for the real thing? Two ways to do that.
Start with IRIS Market
EuropeScore any address in Europe from your browser, with catchments and the demand drivers behind each score. Ranking, never a revenue forecast.
- Unlimited scores on the market you licence
- €6,000 a year, per market. No sales data needed
Book a demo
WorldwideSee your own locations in the platform, for the market you care about most.
- Your own stores, in your own market
- Talk to someone who actually builds the models
Customer stories
Decisions that held up in the real world.
95% of deployed models still in production. Not a model-accuracy claim.
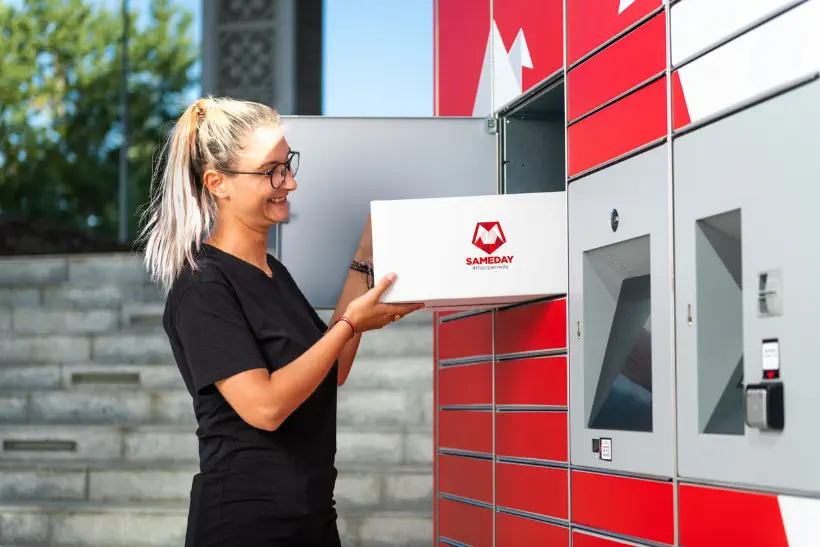 Last-mile · 6,000+ points
From intuition to insight for last-mile locations.
Read the Sameday story → QSR · 130+ locations
Turning a delivery shift into a revenue model.
Read the Kwalitaria story →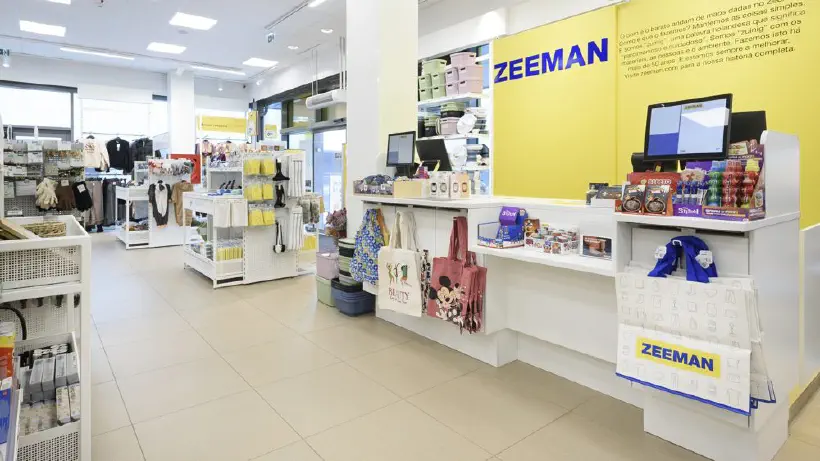 Retail · ~1,400 stores
A critical mirror for a 1,400-store retail network.
Read the Zeeman story →"The IRIS platform is now an essential part of our decision-making process. It allows us to test scenarios, predict outcomes, and ensure our growth is sustainable and aligned with market demand."
Gheorghe Marius Adrian, Easybox Business Director at Sameday
Who runs on IRIS
Built for the teams whose growth runs on location.
Started with the two verticals where a single opening moves the year: quick-service food and retail chains.
 Quick-service & food
Quick-service & food
Model catchments, forecast turnover per revenue stream, and see whether the delivery demand is really there before you sign the lease.
Quick-service restaurants → Retail chains
Retail chains
Purchasing power, household composition and footfall for every catchment, so openings, relocations and closures are decisions, not gut calls.
Retail chains →Also used by subscription businesses. See all industries →
Two teams, one number
Built for the decision-owner. Documented for your data team.
The same forecast has to survive the room where the call gets made and the stack where your engineers work. Neither team has to do the other's job.
 The decision team
Run it yourself
The expansion lead owns the workspace and runs scenarios directly. No data scientist in the loop, no ticket queue.
See the workspace →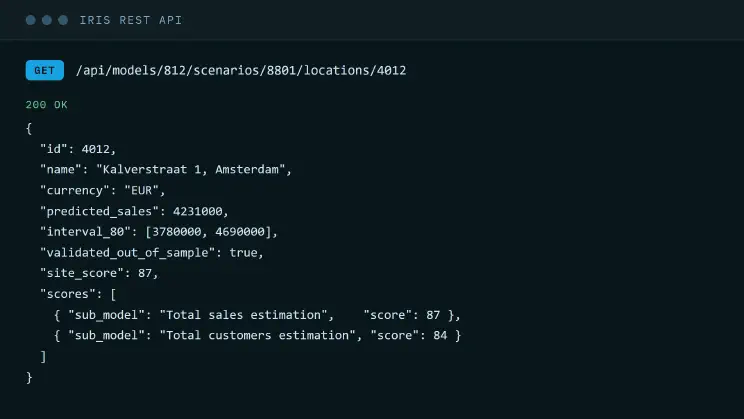 The data team
Wire it in
A documented REST API and MCP server, with full export, so your data team can pull IRIS into their own stack and governance.
For your data team →Independent and European
The model is yours, and it's built in Europe.
You own the model and its outputs, and your own data stays yours: never resold, never used to train anyone else's without your permission. IRIS is built and run in Europe and deployed for clients worldwide. The market data underneath is aggregated to roughly 120 m hexes, so very little personal data is ever in play.
Common questions
The questions expansion teams ask first.
How do you forecast revenue for a new store?
What is catchment analysis?
How is the forecast validated?
Do we need a data scientist or GIS team to use IRIS?
More on accuracy, data handling and when to ignore a forecast in the full FAQ.
See a live forecast in your market, proven on your own stores.
A store lease is a multi-year bet, signed before the doors open. Book a demo and we will forecast a live location in your market. Then a Validation Sprint reads it on your own stores, before you commit.
- Refunded first-year licence if we miss the promised accuracy
- Validated on your own stores before you sign
- Your data stays in the EU. No shared-model training without permission